
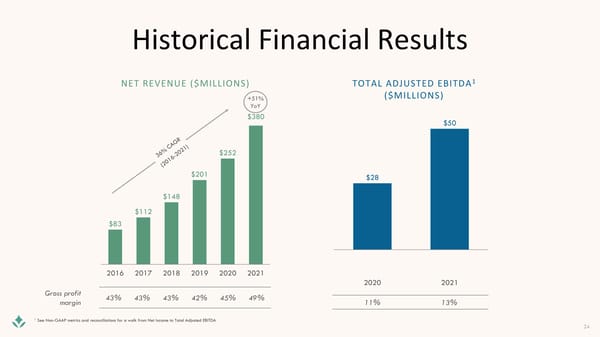
Historical Financial Results NET REVENUE ($MILLIONS) TOTAL ADJUSTED EBITDA1 +51% ($MILLIONS) YoY $380 $50 $252 $201 $28 $148 $112 $83 2016 2017 2018 2019 2020 2021 2020 2021 Gross profit 43% 43% 43% 42% 45% 49% margin 11% 13% 1 See Non-GAAP metrics and reconciliations for a walk from Net Income to Total Adjusted EBITDA 24
 William Blair Conference | Microsite Page 23 Page 25