
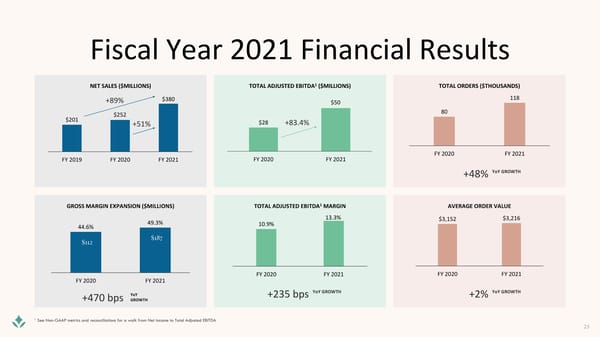
Fiscal Year 2021 Financial Results 1 TOTAL ORDERS ($THOUSANDS) NET SALES ($MILLIONS) TOTAL ADJUSTED EBITDA ($MILLIONS) +89% $380 $50 118 $252 80 $201 +51% $28 +83.4% FY 2019 FY 2020 FY 2021 FY 2020 FY 2021 FY 2020 FY 2021 +48% YoY GROWTH GROSS MARGIN EXPANSION ($MILLIONS) TOTAL ADJUSTED EBITDA1MARGIN AVERAGE ORDER VALUE 49.3% 13.3% $3,152 $3,216 44.6% 10.9% $112 $187 FY 2020 FY 2021 FY 2020 FY 2021 FY 2020 FY 2021 YoY +235 bps YoY GROWTH +2% YoY GROWTH +470 bps GROWTH 1 See Non-GAAP metrics and reconciliations for a walk from Net Income to Total Adjusted EBITDA 25
 William Blair Conference | Microsite Page 24 Page 26