
William Blair Conference | Microsite
This document provides information about BRILLIANT EARTH's investment highlights, financial overview, and mission to create a more transparent, sustainable, and compassionate industry. The investment highlights include the company's authentic, mission-driven brand, diverse leadership team committed to inclusion, massive market opportunity, technology-enabled and data-driven business model, unique and exclusive products, exceptional customer experience, capital-efficient operating model, and omnichannel model driving growth and conversion.
William Blair 42nd Annual Growth Stock Conference June 8, 2022
Forward-Looking Statements This presentation and statements to be made on the earnings conference call (collectively, the “Presentation”), contain forward-looking statements within the meaning of the Private Securities Litigation Reform Act of 1995. All statements other than statements of historical facts contained in this Presentation may be forward-looking statements. Forward looking statements in this Presentation include but are not limited to statements regarding our future results of operations and financial position, business strategy, and plans and objectives of management for future operations, including, but not limited to, statements regarding expected growth, future capital expenditures, and debt service obligations. In some cases, you can identify forward-looking statements by terms such as ”anticipate,” “believe,” “contemplates,” “continues,” “could,” “estimate,” “evolve,” “expect,” “intend,” “may,” “plan,” “potential,” “predict,” “seek,” “should,” “strategy,” “target,” “will,” or “would,” or the negative of these terms or other similar expressions. Accordingly, we caution you that any such forward-looking statements are not guarantees of future performance and are subject to risks, assumptions, and uncertainties that are difficult to predict. We have based these forward-looking statements largely on our current expectations and projections about future events and trends that we believe may affect our financial condition, results of operations, business strategy, short term and long-term business operations and objectives, and financial needs. Although we believe that the expectations reflected in these forward-looking statements are reasonable as of the date made, actual results may prove to be materially different from the results expressed or implied by the forward-looking statements. These forward-looking statements are subject to a number of risks, uncertainties, and assumptions, including, but not limited to: the Company has grown rapidly in recent years and has limited operating experience; the Company may be unable to manage growth effectively; increases in costs of diamonds, other gemstones and precious metals supply shortages; the Company’s ability to maintain a low cost of production and distribution; fluctuations in the pricing and supply of diamonds, other gemstones, and precious metals, particularly responsibly sourced natural and lab- growndiamonds and recycled precious metals such as gold, increases in labor costs for manufacturing such as wage rate increases, as well as inflation, and energy prices; the Company’s ability to cost-effectively turn existing customers into repeat customers or to acquire new customers; risks related to the Company’s expansion plans in the U.S.; an overall decline in the health of the economy and other factors impacting consumer spending, such as recessionary conditions, governmental instability, war or the threat of war, and natural disasters may affect consumer purchases; the Company has a history of losses, and may be unable to sustain profitability; competition in the fine jewelry retail industry; the Company’s ability to manage its inventory balances and inventory shrinkage; a decline in sales of Create Your Own rings would negatively affect the Company’s business, financial condition, and results of operations; the Company ability to maintain and enhance its brand; the Company’s marketing efforts to help grow its business may not be effective; environmental, social, and governance matters may impact the Company’s business and reputation; risks related to the Company’s e-commerce and omnichannel business; the Company’s ability to effectively anticipate and respond to changes in consumer preferences and shopping patterns; the Company’s results of operations and operating cash flows could fluctuate on a quarterly and annual basis, which may make it difficult to predict its future performance; the Company’s principal asset is its interest in Brilliant Earth, LLC, and, as a result, the Company depends on distributions from Brilliant Earth, LLC to pay its taxes and expenses; risks related to the Company’s obligations under its Tax Receivable Agreement and its organizational structure; and the other risks, uncertainties and the factors described in the section titled “Risk Factors” in the Company's Annual Report on Form 10-K for the year ended December 31, 2021. Although the Company believes that the expectations reflected in its forward-looking statements are reasonable, it cannot guarantee future results. The Company has no obligation, and does not undertake any obligation, to update or revise any forward-looking statement made in this Presentation to reflect changes since the date of this Presentation, except as may be required by law. Disclosure Regarding Non-GAAP Financial Measures and Key Metrics This Presentation contains certain financial measures not presented in accordance with US Generally Accepted Accounting Principles ("GAAP"). These non-GAAP financial measures provide users of our financial information with useful information in evaluating our operating performance and exclude certain items from net income that may vary substantially in frequency and magnitude from period to period. Please refer to the section of this presentation entitled “Non-GAAP Metrics and Reconciliations” for a reconciliation of GAAP to non-GAAPfinancial information. This Presentation also contains certain key business metrics which are used to evaluate our business and growth trends, establish budgets, measure the effectiveness of our sales and marketing efforts, and assess operational efficiencies. We define total orders as the total number of customer orders delivered less total orders returned in a given period (excluding those repair, resize, and other orders which have no revenue). We view total orders as a key indicator of the velocity of our business and an indication of the desirability of our products to our customers. Total orders, together with AOV, is an indicator of the net sales we expect to recognize in a given period. Total orders may fluctuate based on the number of visitors to our website and showrooms, and our ability to convert these visitors to customers. We believe that total orders is a measure that is useful to investors and management in understanding our ongoing operations and in an analysis of ongoing operating trends. We define average order value, or AOV, as net sales in a given period divided by total orders in that period. We believe that AOV is a measure that is useful to investors and management in understanding our ongoing operations and in an analysis of ongoing operating trends. AOV varies depending on the product type and number of items per order. AOV may also fluctuate as we expand into and increase our presence in additional product categories and price points, and open additional showrooms. Industry and Market Data We include in this Presentation statements regarding factors that have impacted our industry. Such statements are statements of belief and are based on industry data and forecasts that we have obtained from internal company surveys, publicly available information, industry publications and surveys and third-party studies. Industry publications, surveys and forecasts generally state that the information contained therein has been obtained from sources believed to be reliable, but there can be no assurance as to the accuracy or completeness of such information. Certain market, ranking and industry data included in the Presentation, including the size of certain markets and our size or position and the positions of our competitors within these markets, including our services relative to our competitors, are based on estimates of our management. These estimates have been derived from our management's knowledge and experience in the market in which we operate, as well as information obtained from internal company surveys, industry publications and surveys, third-party studies and other publicly available information related to the market in which we operate. Unless otherwise noted, all of our market share and market position information presented in this Presentation is an approximation based on management's knowledge. In addition, while we believe that the industry information included herein is generally reliable, such information is inherently imprecise. While we are not aware of any misstatements regarding the industry data presented herein, our estimates involve risks and uncertainties and are subject to change based on various factors. Trademarks This Presentation includes our trademarks and trade names which are protected under applicable intellectual property laws and are our property. 2
Our mission is to create a more transparent, sustainable and compassionate jewelry industry 3
The Next Generation Mission-Driven Fine Jeweler Ethos for Today’s Personalized, Digitally Native, Consumer Joyful Omnichannel Tech-Driven Customer and Customer- Experience Obsessed Unique and Brilliant Earth is a global leader in fine jewelry. Award-Winning We are successfully executing our strategy Designs to transform and modernize the jewelry industry. 4
Brilliant Earth by the Numbers Proven $410mm 50% $3,174 50% 12.8% Financial Performance 1 1 1 1 1 TTM Q1 FY22 Revenue Y/Y Revenue Growth AOV Gross Margin Adj. EBITDA High Brand 75+ 62% Affinity NPS2 Aided Brand Awareness3 Our success is driven by our highly tech-focused and customer-centric approach 1 For the trailing twelve-month period ended Mar 31, 2022; 2 3 2016-2021 Bizrate; Brilliant Earth Customer Insight Survey May 2022 5
Company History Brilliant Earth reaches consumers in all U.S. states and over 50 countries through our e-commerce platform and 19 showrooms 2015 2019 >$50mm in sales >$200mm in sales 2013 2005 2008 Launches blockchain >$25mm in sales Launches Brilliant Earth enabled diamonds Mobile School in the Founded in San Early adopter of Launches Australian Democratic Republic of Rainforest Alliance product Francisco social media website Congo partnership 2005 2008 2012 2013 2014 2015 2016 2017 2018 2019 2020 2021 2012 2017 2020 2021 Launches Canadian >$100mm in sales >$250mm in sales Tacori website product Launches UK website Offers virtual partnership Begins offering appointments lab-created diamonds Opens 15th Simone I. Smith product showroom Raises only outside equity partnership round Listed as public company 6
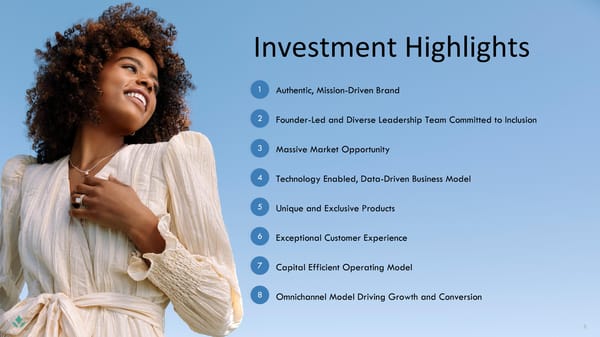
Investment Highlights
Investment Highlights 1 Authentic, Mission-Driven Brand 2 Founder-Led and Diverse Leadership Team Committed to Inclusion 3 Massive Market Opportunity 4 Technology Enabled, Data-Driven Business Model 5 Unique and Exclusive Products 6 Exceptional Customer Experience 7 Capital Efficient Operating Model 8 Omnichannel Model Driving Growth and Conversion 8
1 Authentic, Mission-Driven Brand Authentic Brand for a New Generation of Consumer Mission-Driven Unique and Exceptional Omnichannel Values Award-Winning Designs Customer Experience ✦ Transparent, responsible sourcing ✦ Unique, proprietary designs ✦ High-touch premium service ✦ Sustainability practices ✦ Premium quality ✦ Unique omnichannel experience 1 ✦ Giving back ✦ Highly personalized ✦ High NPS of 75+ 2 ✦ Diversity, Equity, and Inclusion ✦ 62% word-of-mouth referral 1 2 2016-2021 Bizrate; 62% of customers cited word-of-mouth referral as an important factor in their decision to purchase from Brilliant Earth according to the Brilliant Earth Customer Survey May 2021 9
2 Founder-Led and Diverse Leadership Team Committed to Inclusion DRIVING CORPORATE, TEAM, AND PRODUCT INITIATIVES Leader in ESG 88% ✦ Hulu’s Happiest Season with ✦ Blockchain Technology Kristen Stewart and Dan Levy of employees say ✦ GIA Origin Report Diamonds ✦ Simone I. Smith ✦ Rainforest Alliance “I am proud ✦ FSC certified jewelry boxes to work at ✦ Certified Carbonfree© company Supply Chain 1 ✦ Issued inaugural Sustainability Brilliant Earth” Report in March 2022 highlighting Transparency our commitment to sustainability, transparency and inclusion Purpose- Diversity, Environment Driven Product Equity & Inclusion Partnerships Sustainability Social Team-Driven Initiatives Initiatives ✦ Female CEO with majority female board ✦ Team 79% female2 / 41% diverse2 Supply Chain Impact Initiatives ✦ Gender-fluid, inclusive products Sourcing & Governance Compliance ✦ Wellness and sustainability focus ✦ Commitment to volunteering ✦ Recycled precious metals – 93% of gold and 99.8% of ✦ Brilliant Earth Mobile School in DRC 3 ✦ Gold mining training in mercury-free methods silver in BRLT’s jewelry is recycled ✦ MoyoGemstones from female artisanal miners ✦ Beyond Conflict Free Diamonds™ ✦ Lab-Grown Diamonds ✦ COVID-relief efforts 1 2 As of 2021 employee engagement survey; As of February 2022 3Based on 2021 audit 10
3 Massive Market Opportunity Tailwinds from Changing 73% of Millennials are willing Consumer Preferences to spend more on a Engaged with social and environmental product if it comes from a issues brand that stands for sustainability3 ✦ Digitally savvy shoppers ✦ Expect to shop whenever and wherever they want 79% Authenticity, individuality and self- of consumers are changing ✦ Participation of proposee in expression product preferences purchasing process based on social & environmental impacts of their purchase4 67% of Millennials and 7 in 10 Strong influence and engagement Gen Z buy or with social media research diamond 81% jewelry online1 proposees were involved in selecting or purchasing of proposees looked their ring2 for ring inspiration on social media5 1 2 3 Bain & Company, The Global Diamond Industry 2020-21, February 2021; The Knot, The Knot 2020 Jewelry & Engagement Study, December 2020; Nielsen, Global Corporate Sustainability Report, 2015; 4 5 Capgemini Research Institute, How Sustainability is Fundamentally Changing Consumer Preferences, July 2020; The Knot, The Knot 2019 Jewelry & Engagement Study, November 2019 11
4 Technology Enabled, Data-Driven Business Model DataCapabilities Drive The Brilliant Earth Experience Tech-enabled data analysis drives curated Customer interactions are tracked and analyzed product assortment in-store and online in an integrated CRM / ERP system Refined testing and sophisticated algorithms Rapidly growing customer base resulting in optimize e-commerce platform larger first-party data warehouse Product development cycle based on data-driven Leverage first- and third-party data to inform insights from consumer preferences real estate decisions 12
5 Unique and Exclusive Products Known for beautiful, unique designs Unique, ✦ In-house, award-winning design studio Personalized ✦ Hand-crafted designs exclusive to Brilliant Earth ✦ Over two-thirds of designs are proprietary1 Products ✦ Innovative, curated collection Agile product development ✦ Customer-insight and trend driven ✦ 3-month development cycle Create-Your-Own model ✦ Enables personalization ✦ Vast virtual inventory of over 150,000 diamonds1 1 2 As of Q1 2021, As of June 6, 2022 13
6 Exceptional Customer Experience Create-Your-Own Model Drives HighInventoryTurnsand Negative Working Capital Select Setting Metal Ring Higher-Quality Diamond Style Choice Size Finished Product 150k+ Virtual inventory of natural & lab-grown diamonds offers broad range of options for customers1 6 – 12 Business day typical make-to-order turnaround Supply chain advantages from long term strategic relationships and strong technology integration 1 As of June 6, 2022 14
6 Exceptional Customer Experience Modern Digital Experience INDUSTRY LEADING CAPABILITIES LEAD TO HIGHER ENGAGEMENT AND CONVERSION Strong product personalization ✦ Leading product visualization ✦ Augmented Reality virtual try on Smart product technology ✦ Product configurators ✦ Recommendation engine Seamless omnichannel ✦ Virtual and physical appointment creation 15
6 Exceptional Customer Experience Delightful Showroom Experience Tech-enabled • Custom curated inventory • 1x1 appointment vs 16 “They had plenty of staff yet nobody came to our “When we arrived she already knew our preferences and assistance. We sat for a good ten minutes until we had arranged a nice selection for us! …We felt totally decided to walk out.” comfortable when making the final decision.” vs —Customer review from large mall jeweler —Nov ’20 San Francisco showroom review 16
7 Capital Efficient Operating Model Capital-Efficient Showroom Strategy Virtual Operating leverage from inventory model flexible staffing model Limited inventory required per store; curated for Tech-enabled team supports customer appointments and optimized across customers in other channels when showrooms not in appointment, maximizing workforce utilization Lowerrent expense Larger catchment region vs. Showrooms are principally selected in traditional retail repurposed boutique office spaces, Many customers drive over upper floor retail or lifestyle centers one hour for an appointment 17
Opportunities
Expand Major Growth Internationally Opportunities Expand Purchase Occasions with Existing and New Expand Customers Omnichannel Increase Brand Presence Awareness 19
Continue to Increase Market Share Drivers Opportunity ✦ Scale drives awareness and marketing efficiencies Increase ✦ Frequency of content and engagement across multiple touchpoints 62% Brand ✦ Global influencer partnerships Aided Brand Awareness 1 ✦ Partnership collaborations and marketplace opportunity Awareness Today ✦ Large, attractive and growing market $~280bn Tailwinds ✦ Highly fragmented with opportunity to take share from incumbents ✦ Increasing e-commerce penetration Global Fine Jewelry ✦ Alignment with Millennial and Gen Z values and preferences Market Opporunity2 1 2 Brilliant Earth Customer Insight Survey May 2022; 2021 market size per Euromonitor International, Fine Jewellery, February 2022 20
Bridal is Just the Beginning Fine jewelry represented Special occasions 63% & self-purchase of the global jewelry 1 ✦ Leverage in-house design capabilities market in 2020 Bridal focus ✦ Nimble, data-driven product Traditional today development Jeweler ✦ Enhanced CRM for existing loyal customer base Bridal Profitable Additional Upside First Purchase Fine jewelry market 1 Bain & Company, The Global Diamond Industry 2020-21, February 2021, includes earrings, necklaces, bracelets, and rings (other than engagement or wedding) 21
Positioned to be the Category Winner ✓ Authentic, Mission-Driven Brand ✓ Founder-Led and Diverse Leadership Team Committed to Inclusion ✓ Massive Market Opportunity ✓ Technology Enabled, Data-Driven Business Model ✓ Unique and Exclusive Products ✓ Exceptional Customer Experience ✓ Capital Efficient Operating Model ✓ Omnichannel Model Driving Growth and Conversion 22
Financial Overview
Historical Financial Results NET REVENUE ($MILLIONS) TOTAL ADJUSTED EBITDA1 +51% ($MILLIONS) YoY $380 $50 $252 $201 $28 $148 $112 $83 2016 2017 2018 2019 2020 2021 2020 2021 Gross profit 43% 43% 43% 42% 45% 49% margin 11% 13% 1 See Non-GAAP metrics and reconciliations for a walk from Net Income to Total Adjusted EBITDA 24
Fiscal Year 2021 Financial Results 1 TOTAL ORDERS ($THOUSANDS) NET SALES ($MILLIONS) TOTAL ADJUSTED EBITDA ($MILLIONS) +89% $380 $50 118 $252 80 $201 +51% $28 +83.4% FY 2019 FY 2020 FY 2021 FY 2020 FY 2021 FY 2020 FY 2021 +48% YoY GROWTH GROSS MARGIN EXPANSION ($MILLIONS) TOTAL ADJUSTED EBITDA1MARGIN AVERAGE ORDER VALUE 49.3% 13.3% $3,152 $3,216 44.6% 10.9% $112 $187 FY 2020 FY 2021 FY 2020 FY 2021 FY 2020 FY 2021 YoY +235 bps YoY GROWTH +2% YoY GROWTH +470 bps GROWTH 1 See Non-GAAP metrics and reconciliations for a walk from Net Income to Total Adjusted EBITDA 25
First Quarter FY22 Financial Results Q1 NET SALES ($MILLIONS) Q1 GROSS MARGIN EXPANSION ($MILLIONS) Q1 ADJUSTED EBITDA1 50.1% $100.0 $50.1 $70.7 $8.4M 45.8% $32.4 8.4% OF NET SALES Q1 2021 Q1 2022 Q1 2021 Q1 2022 41.5% SALES +432 bps YoY GROWTH GROWTH 1 See Non-GAAP metrics and reconciliations for a walk from Net Income to Total Adjusted EBITDA 26
Long-term Target Model Target Drivers Net Revenue Growth High 20%s – low 30%s Growth across our product lines and our omnichannel model Mid 50%s Premium products and brand, price Gross Profit Margin optimization engine, procurement efficiencies and growth of higher margin fine jewelry Growth of brand awareness and continued Marketing Expenses as a % of Net Revenue Mid to high teens rollout of unique joyful digital and showroom experiences to drive conversion and repeat behavior 15-20%+ Gross margin expansion and improved Total Adj. EBITDA Margin effectiveness of our marketing spend and leverage in our G&A expenses Note: These are not projections; they are goals / targets and are forward-looking, subject to significant business, economic, regulatory and competitive uncertainties and contingencies, many of which are beyond the control of the Company and its management, and are based upon assumptions with respect to future decisions, which are subject to change. Actual results will vary and those variations may be material. For discussion of some of the important factors that could cause these variations, please consult the "Risk Factors" section of the company’s last issued 10-K. Nothing in this 27 presentation should be regarded as a representation by any person that these goals / targets will be achieved and the Company undertakes no duty to update its goals.
Non-GAAP Metrics and Reconciliations Three months ended Twelve months ended ADJUSTED EBITDA March 31, December 31, ($THOUSANDS) 2022 2021 2021 2020 Net income, as reported 3,369 2,408 26,256 21,576 Interest expense 1,776 1,926 7,589 4,942 Income tax expense/(benefit) 96 - (316) - Depreciation expense 349 164 860 646 Showroom pre-opening expense 475 163 2,773 242 Equity-based compensation expense 2,104 93 2,795 46 Other expense, net1 59 620 6,601 74 Transaction costs & other expense2 146 1,129 3,926 - Adjusted EBITDA 8,374 6,503 50,484 27,526 Net income margin 3.4% 3.4% 6.9% 8.6% Adjusted EBITDA margin 8.4% 9.2% 13.3% 10.9% Note: Fiscal year ended December 31 1 Other expense, net in the 2021 periods consisted primarily of the change in fair value of the warrant liability necessary to mark our warrants to fair market value. Additionally, these expenses for all periods presented include losses on exchange rates on consumer payments, partially offset by interest and other miscellaneous income. 2 These expenses are those that we did not incur in the normal course of business. They include expenses related to professional fees in connection with the evaluation and preparation for operations as a public company, a charitable donation, and one-time costs associated with the opening of a new operations facility in 2021. 28